|
|
 |

|
|
|
> Postflight
Two weeks following the mission, each crew member attends a private debrief. Here the crewmembers are provided with graphs of their own physiological dta obtained inflight. Each response is plotted against Mission Elapsed Time (MET), here recording began at 2hr, 10 minutes before launch (-L/02:10) to 3 hrs and 30 minutes into mission day 0 (the first day in space - 0/03:30). The graph shows heart rate was highest at MECO - main engine cut-off.Flight data were collected using the Autogenic-Feedback System-2 (AFS-2).
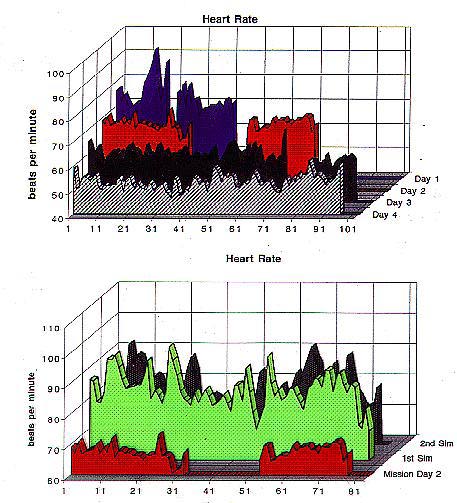
This graph shows the heart rate data of one of the crewmembers above, during the first four days of spaceflight. Note that in the top 3-D chart, the "peak" of heart rate noted during MECO, is in the back. As mission days proceed, heart rate becomes lower. The second 3-D chart shows this same crewmember's during two Earth-based simulations of Mission day two and the actual flight data of mission day two. Work load and activity plan are the same - but the absense of gravity makes heart rate significantly lower.
Actual data of six crewmembers during their first four days in space are available on CD ROM by contacting the Life Sciences Archive. Data are in raw form (100 Hz samples), one minute and ten minute means in Microsoft Excel spreadsheet format and graphs like those shown above. Inquiries for more information about the Psychophysiology Laboratory or about Fellowship programs (NRC, postdocs, faculty fellowships) should be directed to Dr. Patricia Cowings.
|
|
|